आज ही PU Xtrader Challenge में शामिल हों।
सिम्युलेटेड कैपिटल के साथ व्यापार करें और हमारे ट्रेडर मूल्यांकन उत्तीर्ण करने के बाद वास्तविक लाभ कमाएं।
आज ही PU Xtrader Challenge में शामिल हों।
सिम्युलेटेड कैपिटल के साथ व्यापार करें और हमारे ट्रेडर मूल्यांकन उत्तीर्ण करने के बाद वास्तविक लाभ कमाएं।
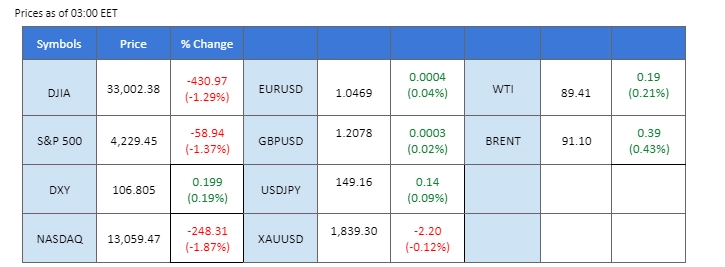
The financial landscape remains turbulent as global markets react to a host of impactful factors. The Japanese yen’s sudden dipped after hitting the pivotal 150 level has spurred speculation about potential intervention by Japanese authorities. Meanwhile, the greenback has been on a relentless ascent, buoyed by robust economic data and growing expectations of Federal Reserve interest rate hikes. This trajectory has pushed US Treasury yields to their highest levels since 2007, prompting a dip in the US equity market, particularly within the tech sector. Amidst this volatility, oil prices defied a strengthening dollar, thanks to a bullish inventory report.
Current rate hike bets on 1st November Fed interest rate decision:
Source: CME Fedwatch Tool
0 bps (72.0%) VS 25 bps (28%)


The US dollar continued to strengthen against the backdrop of bullish economic data. Notably, the US Bureau of Labor Statistics reported a substantial increase in job openings, with JOLTs job openings rising from 8.920 million to 9.610 million, surpassing market expectations. This robust economic outlook raised the odds of the Federal Reserve increasing interest rates this year, resulting in 10-year and 30-year Treasury yields reaching their highest levels since 2007.
The Dollar Index is trading higher while currently testing the resistance level. However, MACD has illustrated diminishing bullish momentum, while RSI is at 74, suggesting the index might enter overbought territory.
Resistance level: 107.20, 108.95
Support level: 105.45, 103.25
Gold prices continued to hover around support levels as investors awaited more US economic data, particularly the Nonfarm Payrolls and Unemployment Rate reports later in the week. However, the long-term trend for the gold market remained negative, weighed down by the strengthening US Dollar and surging US Treasury yields.
Gold prices are trading lower following the prior breakout below the previous support level. However, MACD has illustrated diminishing bearish momentum, while RSI is at 20, suggesting the commodity might enter oversold territory.
Resistance level: 1840.00, 1890.00
Support level: 1790.00, 1715.00
The euro has persistently faced headwinds, extending its losses as the resurgent US Dollar exerts continued pressure on the EUR/USD pair. In the day ahead, investor focus remains locked on the European Producer Price Index (PPI) and Retail Sales figures for August, scheduled for release later today. Market analysts anticipate a steepening contraction in the EU PPI for August, from -7.6% to -11.6%. Concurrently, Retail Sales for the same period are also expected to decline, from -1% to -1.2%, further underscoring the economic challenges faced by the Eurozone.
EUR/USD is trading lower while currently testing the support level. MACD has illustrated diminishing bearish momentum, while RSI is at 29, suggesting the pair might enter oversold territory.
Resistance level: 1.0610, 1.0795
Support level: 1.0445, 1.0205
The Japanese yen experienced a significant surge, breaching the crucial 150 level, prompting market speculations about possible intervention by Japanese policymakers to support the currency. This abrupt move saw the US dollar breaking above 150 for the first time since October 2022, only to tumble to a low of 147.30 as the yen strengthened.
USD/JPY is trading lower while currently near the support level. MACD has illustrated increasing bearish momentum, while RSI is at 43, suggesting the pair might extend its losses after breakout since the RSI stays below the midline.
Resistance level: 150.25, 151.45
Support level: 148.50, 146.25
The Australian dollar maintained a consolidative stance following the Reserve Bank of Australia’s (RBA) monetary policy decisions. The RBA opted to keep interest rates steady at 4.10% during its policy meeting. This decision, in contrast to potential interest rate hikes by other central banks like the Fed, could exert downward pressure on the Aussie dollar in the foreseeable future.
AUD/USD is trading lower while currently testing the support level. MACD has illustrated diminishing bearish momentum, while RSI is at 31, suggesting the pair might enter oversold territory.
Resistance level: 0.6395, 0.6510
Support level: 0.6285, 0.6205
The US equity market edged lower as Treasury yields hit multi-year highs. The tech sector, which had shown signs of recovery the previous day, faced pressure, led by declines in Microsoft Corporation and Meta Platform Inc. Rising Treasury yields typically diminish the appeal of high-growth stocks, exerting downward pressure on tech shares.
The Dow is trading lower following the prior breakout below the previous support level. MACD has illustrated increasing bearish momentum, while RSI is at 27, suggesting the index might enter oversold territory.
Resistance level: 34425.00, 34355.00
Support level: 32745.00, 31645.00
Despite the backdrop of a strengthening US dollar, oil prices rebounded, buoyed by a positive oil inventory report. The American Petroleum Institute (API) reported a substantial decline of -4.210 million barrels in US API Weekly Crude Oil Stock, surpassing market expectations.
Oil prices are trading higher following the prior rebound from the support level. However, MACD has illustrated increasing bearish momentum, while RSI is at 54, suggesting the commodity might experience technical correction since the RSI retreated sharply from overbought territory.
Resistance level: 91.50, 94.35
Support level: 87.75, 85.35

Trade forex, indices, cryptocurrencies, and more at industry-low spreads and lightning-fast execution.

12 December 2023, 05:38 All Eyes On U.S. CPI Reading

11 December 2023, 05:23 Dollar Surges On Exceptional Jobs Data

8 December 2023, 05:50 Yen Rallies On BoJ Hawkish Comment

नए पंजीकरण उपलब्ध नहीं हैं
हम इस समय नए पंजीकरण स्वीकार नहीं कर रहे हैं।
नए साइन अप उपलब्ध नहीं हैं, लेकिन मौजूदा उपयोगकर्ता अपनी चुनौतियों और ट्रेडिंग गतिविधियों को सामान्य रूप से जारी रख सकते हैं।